Difference between revisions of "Noise levels"
(Created page with " === Procedure === thumb|The curve used for the noise estimation In order to estimate the noise, a test pulse is injected on each channel...") |
|||
| Line 7: | Line 7: | ||
=== Results === | === Results === | ||
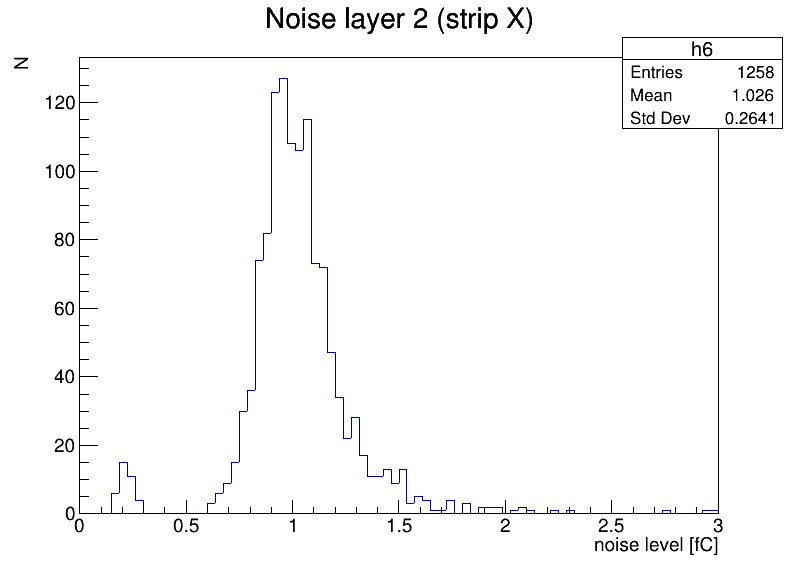
| − | [[File:L2 X hist.png| | + | [[File:L2 X hist.png|frame|Histogram containing the noise on L2 X strips as it was the the 16th of September]] |
| − | [[File:L2 V hist.png| | + | [[File:L2 V hist.png|frame|Histogram containing the noise on L2 V strips as it was the the 16th of September]] |
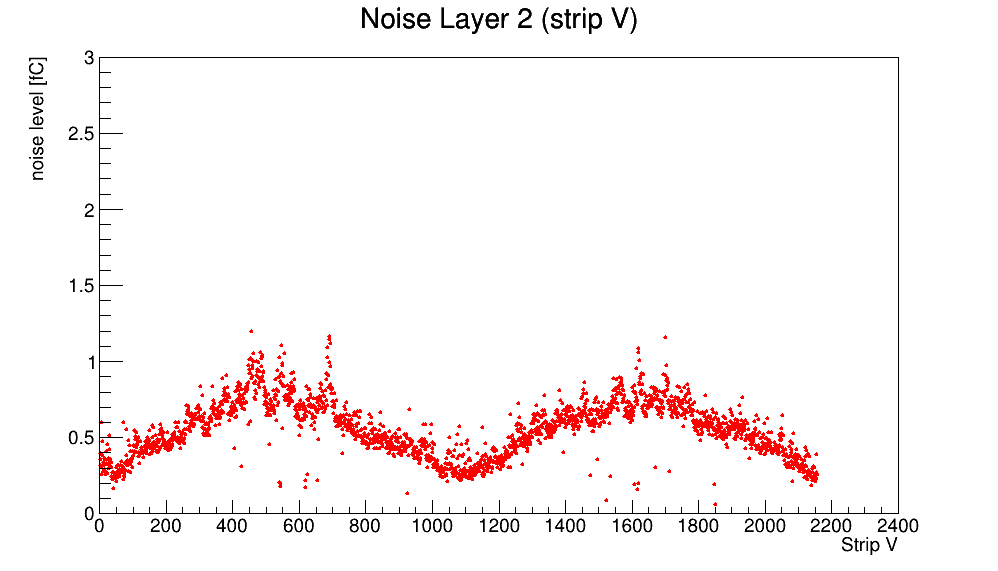
| − | [[File:L2 V.png| | + | [[File:L2 V.png|frame|Plot of the noise on L2 V strips as it was the the 16th of September]] |
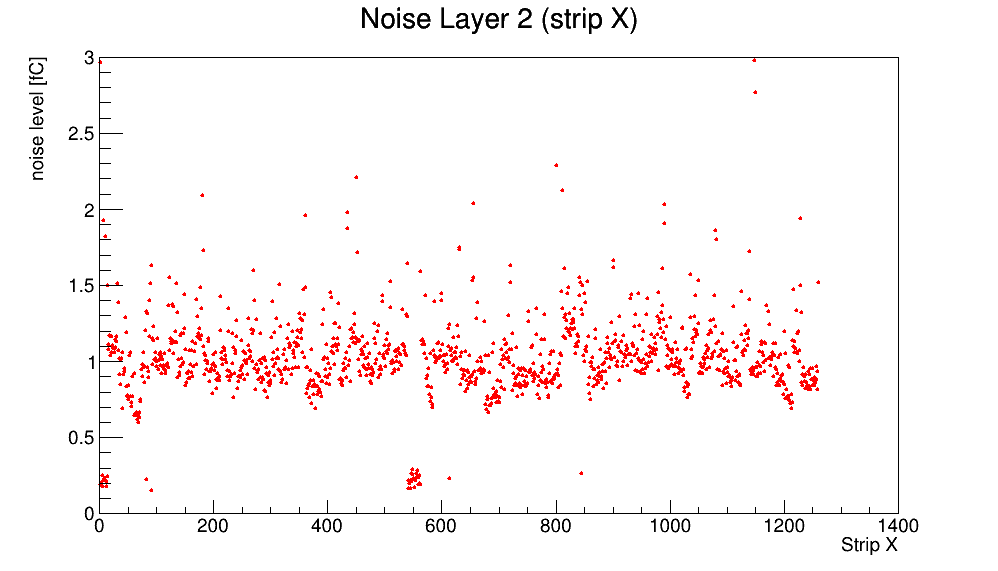
| − | [[File:L2 X.png| | + | [[File:L2 X.png|frame|Plot of the noise on L2 X strips as it was the the 16th of September]] |
Revision as of 03:11, 2 October 2019
Procedure[edit | edit source]
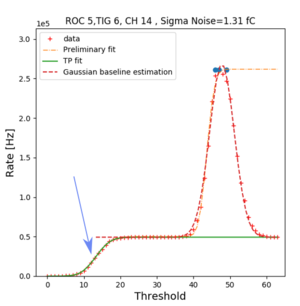
In order to estimate the noise, a test pulse is injected on each channel of the ASIC and a threshold scan is performed in the meanwhile. To measure the noise, we can fit the curve pointed by the blue arrow in the figure. The fit is performed with an error curve and the sigma of this fit gives the noise estimation.


