Noise levels
Procedure[edit | edit source]
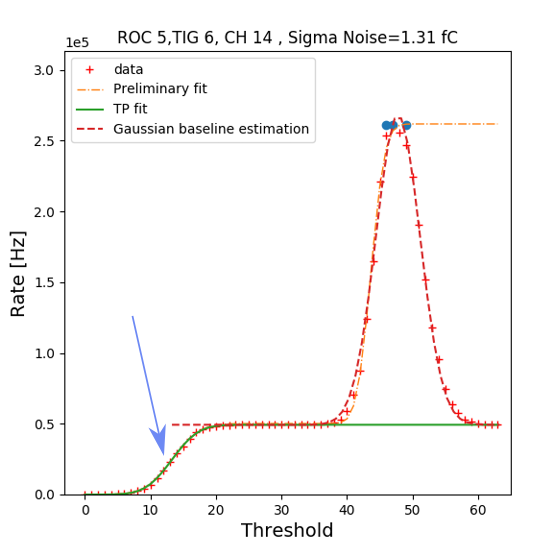
In order to estimate the noise, a test pulse is injected on each channel of the ASIC and a threshold scan is performed in the meanwhile. To measure the noise, we can fit the curve pointed by the blue arrow in the figure. Take into account that lower value of the x axis (DAC values) corresponds to higher values of the threshold in mV.
The fit is performed with an error curve and the sigma of this fit gives the noise estimation.
In order to perform the fit, for first all the points where the threshold is below the baseline (blue dots) are raised at the saturation levels. After that, a preliminary double S-curve fit is performed to decouple the test pulse level from the baseline noise. Then, a fit is performed only on the rising front and the test pulse plateau.
Results[edit | edit source]
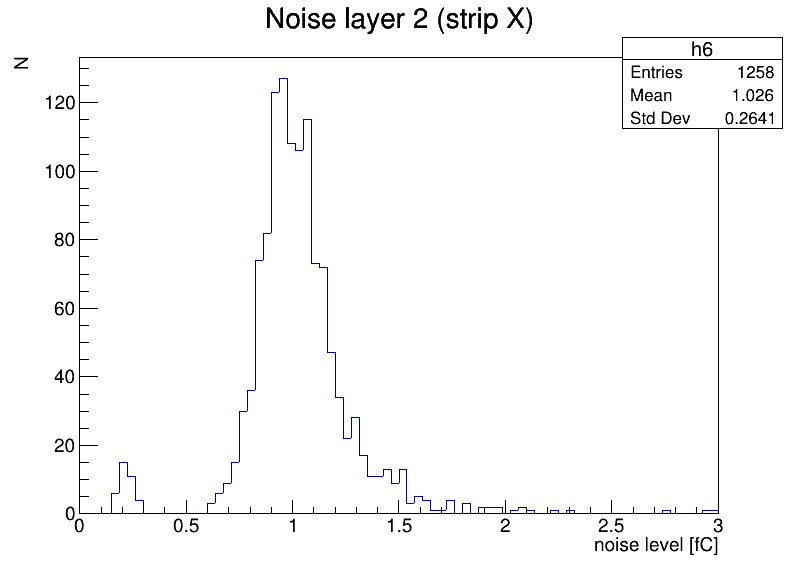
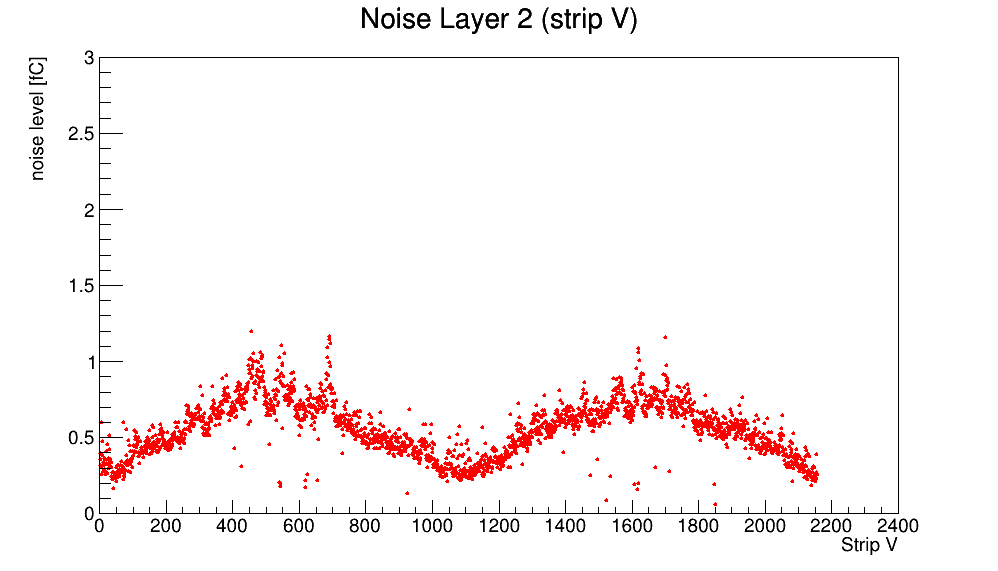
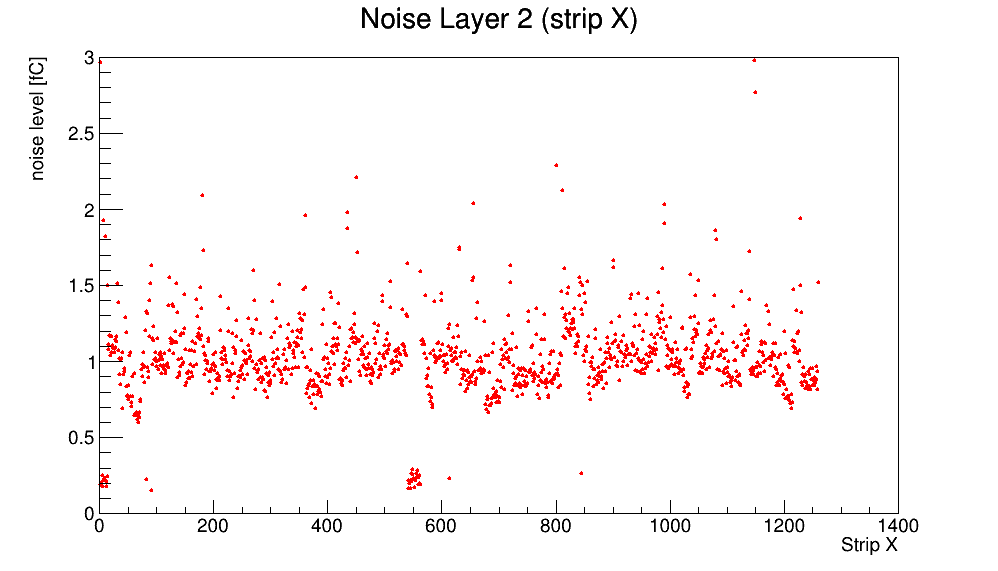
Noise levels for L2 are shown in the following picture. In the red plots, the different length of the V strips can be easily spotted. (Different length-> different capacitance-> different noise). On the X strips, the disconnected area around the 580 X strips is well evident as a low noise area.


